 |
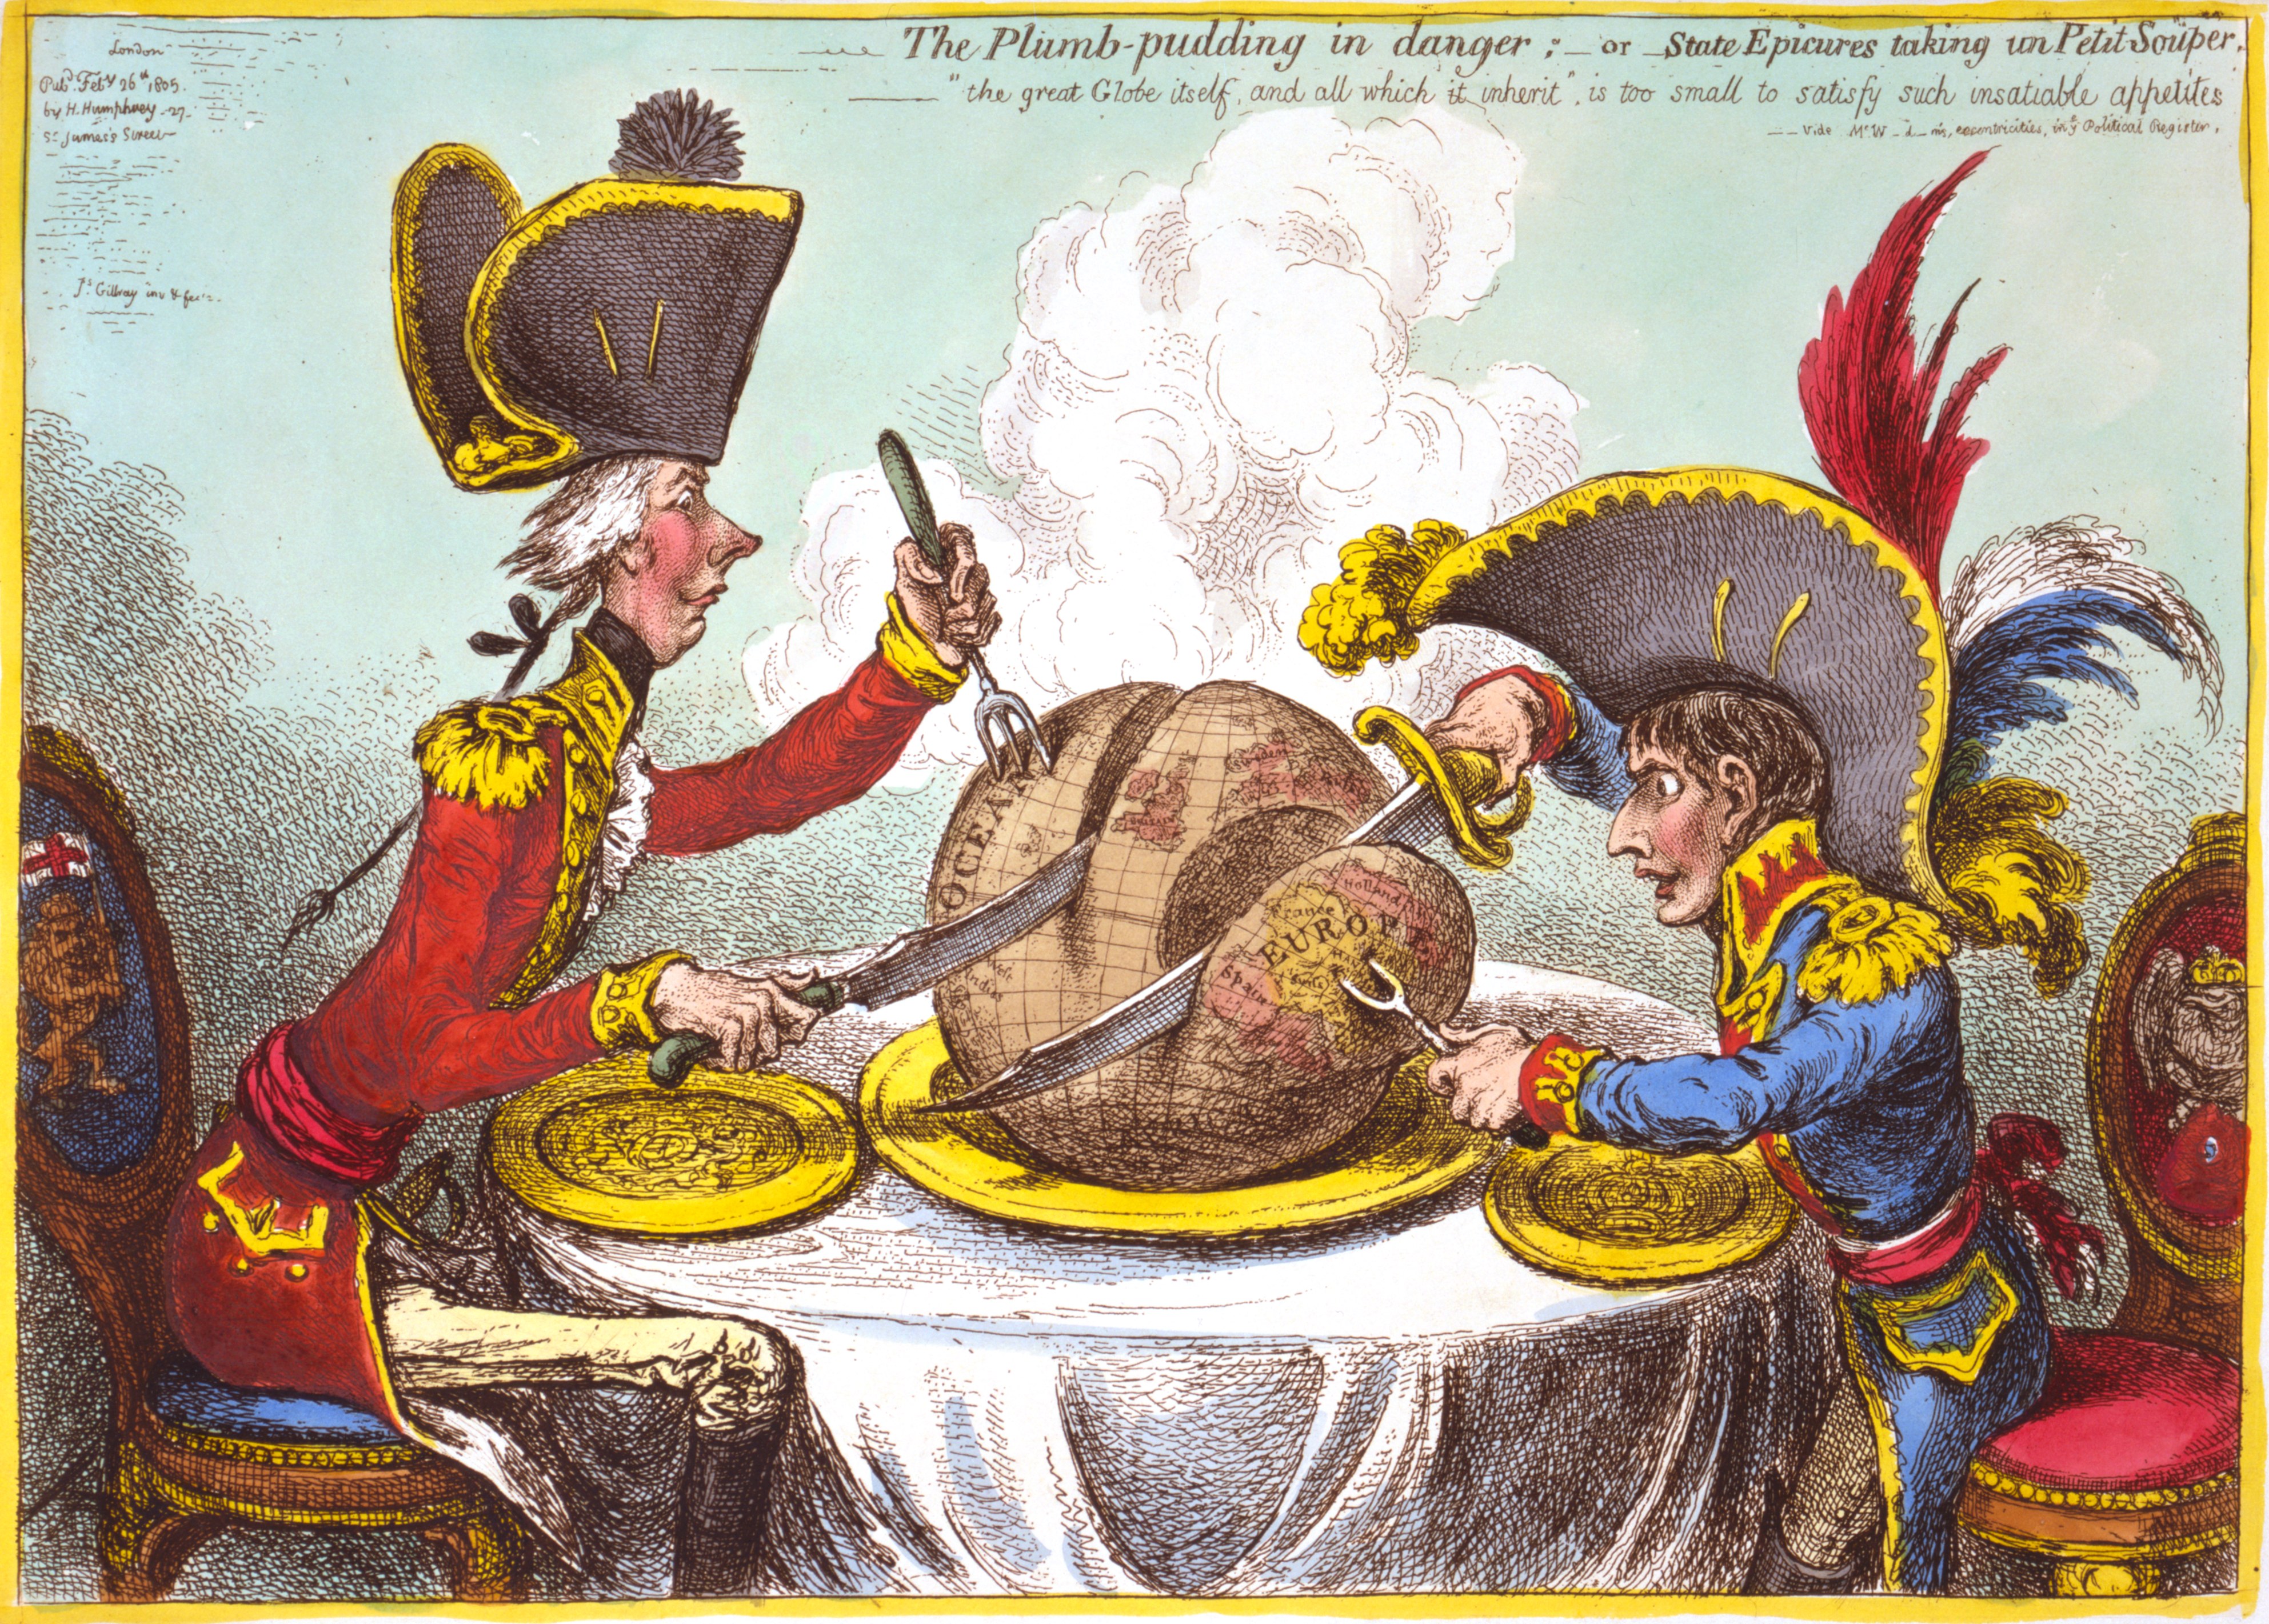
| 1805 caricature of Napoleon and Pitt slicing up the world (source) |
Maps have been the tools of conquerors, one of the biggest cartographic enterprises in the world began at St. Thomas Mount in Madras (on 10 April 1802) followed by a march to Bangalore close on the heels of Tipu Sultan's defeat. The great trigonometrical survey made its way around the country putting a figure for the height of Mt. Everest. Once the view of the world has been simplified, it paves the way for the construction of roads, communication lines, the mass movement of peoples and the extraction of resources - all tools of the master.
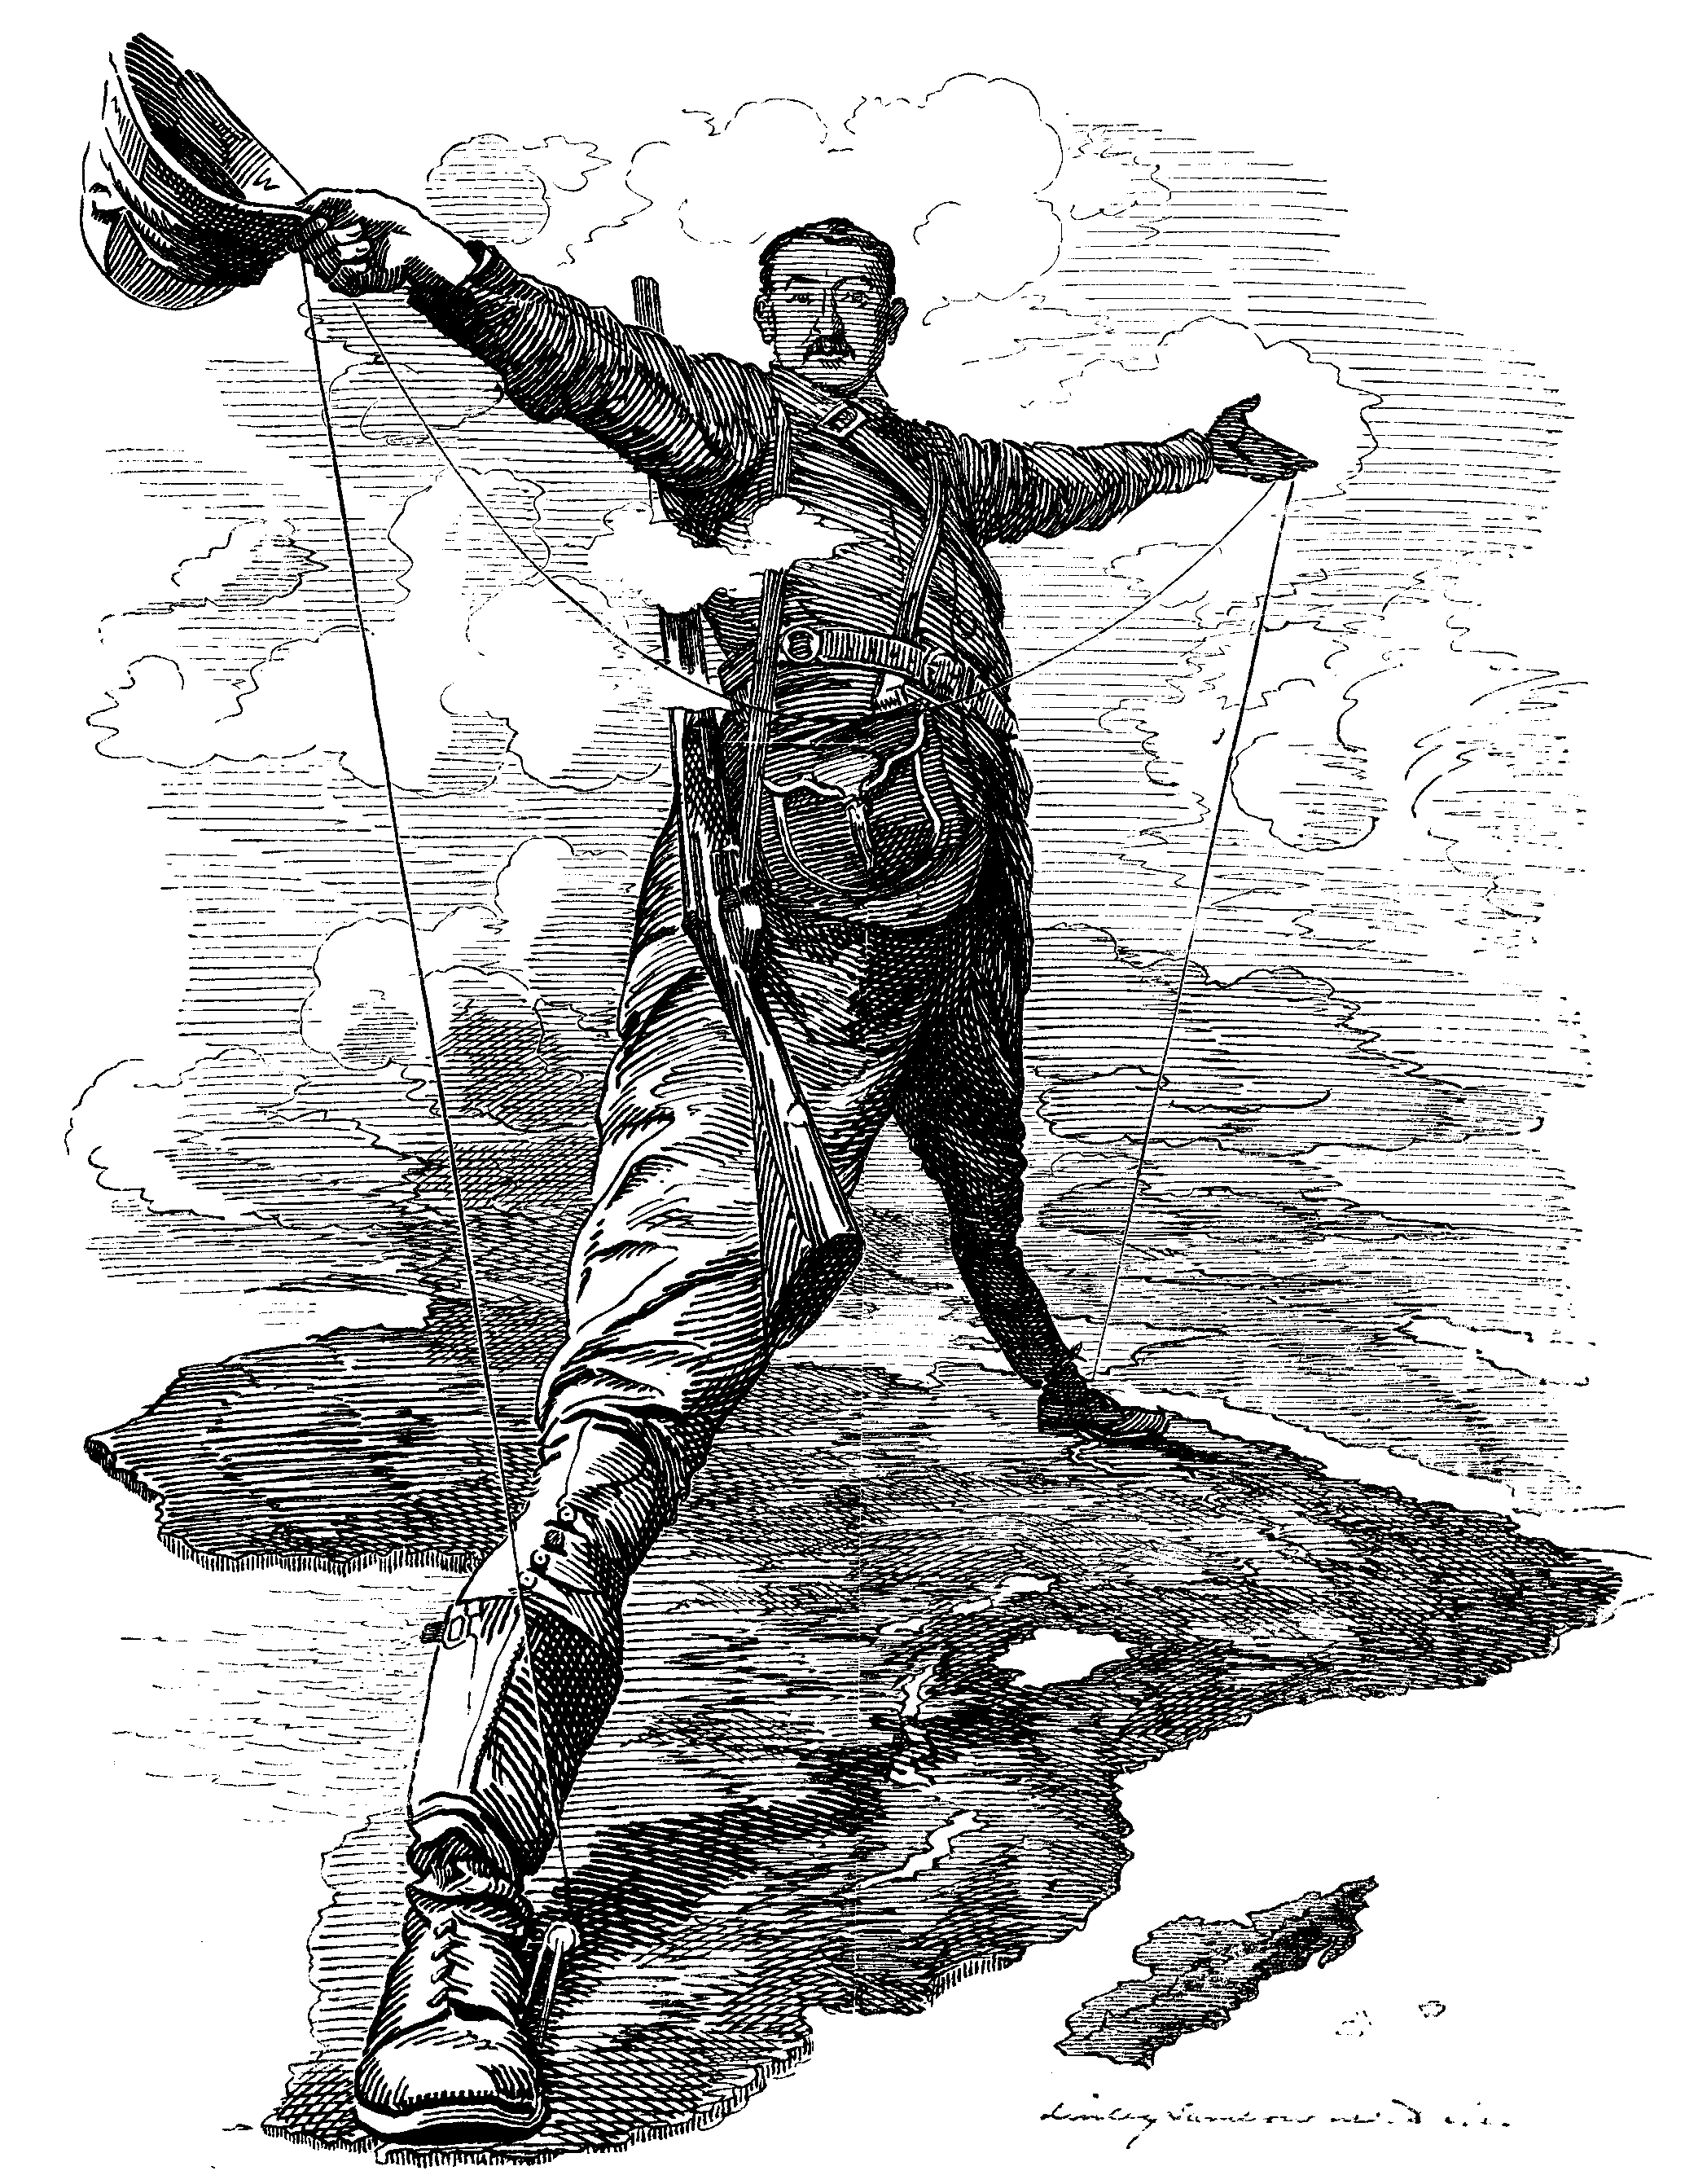 |
| Punch caricature (1892) of Cecil Rhodes connecting the Cape and Cairo by telegraph |
Given our colonial origins, it is not surprising that maps were hidden away from the general populace, and in fact even the current government upholds these old laws and tried to keep maps away from citizens. We are informed that making them accessible would allow "enemies" to bomb critical locations or otherwise do damage! Whether information is value-neutral is always debatable but it seems like information for all or information for none is more equitable and therefore more democratic than information accessible to a select few tyrants, terrorists or government officials.
The simplification that maps are of reality makes them intrinsically political. Drawing boundaries to simplify administration make them even more so. But when did maps get employed in biology. The colonial period coincided with (in fact, actually drove) Victorian natural history - the collection of biological specimens from across the world. They were pickled, skinned, sketched, described and most of them made their ways to a curator at the British Museum or a wealthy private collector who could place material collected over years, across seasons and locations in one place and see if there were patterns to them. And patterns they did find. P L Sclater split the world into six zoological regions, Alfred Russel Wallace found short but strange gaps, Alfred Wegener discovered a jigsaw puzzle and strange long-distance similarities in fossils gave rise to the idea of a dynamic earth surface with Darwin's idea of evolution playing upon it. But these were large scale patterns both in terms of the areas of the regions involved and the period of time involved. The earliest geological map of Britain was produced by little known William Smith and the production of it involved sampling of the ground at various places and looking at the angle and layers of earth, a habit which earned him the nickname of "Strata Smith".
In India too, these Victorians began to look at the fauna, flora and geology of small regions - William Henry Sykes for instance concentrated on the Deccan region ("Dukkun") - he collected numerous animals in the course of his "statistical" surveys and sent them off to Britain where names were given to them. Sykes' Crested Lark - a bird found only in peninsular India bears his name. The Victorian statistical movement was a data gathering enterprise that grew alongside with natural history and the collection of specimens. Supporting these were "Learned societies" and museums, where information was documented, specimens were deposition and ideas discussed. The learned societies were mostly in Britain and enlightened Victorians living in India found this annoying due to the time it took for letters - and this led to the creation of local versions like the Asiatic Society of Bengal and the Madras Literary Society along with museums and journals.
 |
| Wallace's map of the jays (1895) |
There are few maps in any of the early faunal works covering the Indian region. Even the second edition of The Fauna of British India (or "new fauna") has none except perhaps one for informing the reader on the region covered. Even a work like Henry Seebohm's The geographical distribution of the charadriidae (1888) or Geographical distribution of British birds (1893) is devoid of maps. Perhaps it was expensive to print illustrations giving priority to the pictures of animals. Alfred Russel Wallace however needed to include a map to illustrate his thesis in his 1895 Island life or the phenomena and cause of insular faunas and floras.
 |
| Charles Minard packed information on troop size, weather, dates, routes and river crossings in one tiny map in 1869 |
Post 1900s one begins to see maps and map publishers like Bartholomew even had a volume on zoogeography in 1911.
 |
| Hume's observation on rainfall and bird distributions (1878) |
Looking specifically at birds, it would seem like maps were either too expensive to print for each species or perhaps they were not considered informative enough. Hume in his notes in the Stray Feathers often noted the smaller size of specimens from southern India or Ceylon but he does not seem to have been aware of Bergmann's work. The first edition of the Fauna of British India series on birds includes notes on distribution but rarely attempts to find biogeographic delineations. The second edition is more interesting because Stuart Baker introduced the concept of subspecies. Now one would have expected him to carefully describe the boundaries of the subspecies, but this is not done. Little wonder that many of his subspecies are not disjunct, have considerable overlap or are examples of clinal variation. At that time, there was no way to decipher the age of evolutionary divergence and the difference between a subspecies and full-species was always a point of argument. It still is, but the phylogenetic species concept can at least be supported by an objective analysis of sequences - although that method itself has many a slip. Anyway, Baker did not include maps in his work. Salim Ali notes ("Handbook." Volume 1. Introduction. xxiv) about Baker's New Fauna:
"Whistler and Ticehurst in particular joined issue with Baker on a number of his statements and dicta. Many of their objections derived from the fact that large tracts of the country had as yet not been sufficiently explored ornithologically and there remained considerable gaps in our knowledge of the geographical distribution of many 'resident' birds-knowledge which is crucial for a proper application of the subspecies concept."
It has been said that Hugh Whistler (along with Claude Ticehurst) made maps (unavailable to most Indian researchers) that were apparently used by P C Rasmussen for her work. His maps and notes even helped her rediscover the Forest Owlet.
Salim Ali (and Dillon Ripley) brought in maps in their Handbook of the Birds of Indian and Pakistan begun in 1968. It is clear that he(they) was influenced by Whistler's comments on Baker's subspecies. He notes that (Introduction: xxix) "The distribution maps have been constructed or adapted from a number of different sources the chief of which are Atlas of European Birds by K H Voous (Nelson), Waterfowl of the World by Jean Delacour (Country Life), and Birds of the Soviet Union by G P Dementiev, H. Gladkov et al." A survey of the maps in the Handbook shows that they are used for indicating breeding / winter ranges, subspecies and for sister species. Salim Ali was of course influenced by Ernst Mayr whose ideas on speciation, particularly allopatric speciation, lead Salim Ali to make bold claims on the mutually exclusive distributions of sister species.
 |
| Map of Common Kestrel - from Dementiev & Gladkov 1951 |
Some ornithologists were meticulous about documenting where a specimen was taken, whereas others were remarkably cavalier about such things. Sálim Ali, India's greatest ornithologist, cared not a whit about providing exact information on a locality, whereas some lesser-known fieldworkers went to great lengths to geo-reference each important place where work was conducted. Needless to say, we spent more time on the localities with less documentation, conducting the sleuthwork to determine just where they were.Ali includes a chapter on J B S Haldane in his autobiography. Although he held Haldane in great esteem, he does not seem to have heeded Haldane's 1959 advise, possibly because he was fundamentally against Haldane's thesis that supported ahimsa. Elsewhere Ali (1980) actually blamed this religious sentiment for the backwardness of Indian ornithology. Haldane's address on the non-violent scientific study of birds is however a remarkable bit of advice on bird research.
The method of collating data from observers across the country that Haldane suggested in 1959 was not original, he was merely promoting an idea that had taken shape in Britain almost 20 years ahead. Back in Britain, the idea that many people could collaborate to collect data was begun and proven by a man named Tom Harrisson. Tom Harrisson (more on him can be found starting here) was more interested in anthropology and ethnology and started a movement to study human behaviour through what was called Mass Observation. Harrisson started a Political and Economic Planning organization in 1931, in which he was aided by Max Nicholson and Julian Huxley (who was a close associate of Haldane). Nicholson also went on to start the Oxford Bird Census - they decided to get people to report on the Grey Heron (just Heron there) and then the Great Crested Grebe. The Oxford Bird Census became so popular that they could actually have a salaried director - W B Alexander. Now even if Salim Ali chose not to listen to Haldane (due to his leftist/ahimsa stand) he would still have had to hear about this venture from W. B. Alexander's brother, Horace Alexander (also a Gandhian!), who was in India, a birder and a friend of Salim Ali. Anyway the whole result of these bird surveys was that a new organization, the British Trust for Ornithology was created in 1932. Now the result of these studies on birds like the heron is spectacular. Today the BTO can produce amazing historic analyses and systematic data-based statements on clutch size - see the links here , here etc. The fact that neither Salim Ali nor indeed the BNHS or any other Indian organization took this step in spite of such advise is extremely unfortunate. The BNHS has never spent time documenting any policy (perhaps it has no system of evolving internal policy at all) of making information freely available which makes them extremely suspect when it comes to collaboration with citizens. It is also sad that nobody really examines NGOs like the BNHS carefully enough nor are they amenable to suggestion in spite of being greatly funded by tax-payers.
When I began to learn about the birds around me, it was clear that there was considerable location specificity and that the broad picture given in books simply does not hold locally. People who talked to each others at a local scale had a far better picture of what was more likely and what was not (remember also that this was before the Internet, even before telephones were easily accessible) and that perspective was never easily available unless you knew the key people. It was with this perspective that we should be able to see a better picture when data was collated that I wrote up a small bit of software called BirdSpot in 2003 - it is still available for download although not updated. In 2003, Google Earth did not exist and Internet access was still quite expensive. Since then there have been major advances, Google Earth really made geospatial info and georeferencing a breeze. What used to be hard to get became commonplace. Since that time, I have been contacted by a large number of software developers (>50) and several people working with biodiversity related organizations who have sought to make similar system over the web. Although several of them have made use of the data, no mature system has really emerged to make sense of bird data or indeed that of any other taxon. A number of ventures have begun across the country with tremendous amounts of publicity and funding. Projects often spend on software but not on qualified curatorial staff. Another project at NCL Pune got numerous museums and collections to submit label data and created a database. Large funds were apparently made used but a few years later the website vanished, leaving data submitters in the lurch. Numerous other so-called citizen-science projects and biodiversity databases have sprung up with simple PHP frontends to gather entries into a database to gather data (a recent exercise being Citzen Sparrow). Most of them finally display the data as points on Google Maps with little callouts that showing additional metadata. There is a need for a debate on how systems should be designed, and what kinds of legal and philosophical stands they need to take.
The BNHS published a large book on what are termed as "important bird areas" with little spots on maps indicating the locations of such sites. These spots, the introduction to the book claimed, were generated by GIS experts aided by high-end software. The contributors then decide on their favourite birding areas and provide a list of what they have pre-determined as being threatened. From a layman perspective such an effort is inappropriate. A minimally qualified worker would have first created a database of all the bird occurrence data along with information on the habitat specificity, life-history traits, locations where they occur along with abundance estimates. They would then come up with a set of justifiable rules to produce a rational network of important bird areas based on the bird species involved, their current and potential distributions as well as the distributions of already protected areas.
Clearly it seems that Indian scientists are not living up to expectations and if they really need to do citizen science, they should perhaps also be open to suggestions from the (lowly) "citizens". An average netizen today knows that geospatial information can be collated without the need for programming - one can set up a personal Google Map layer, share it and collate notes. Here is a local venture to collate sparrow records, and it did not harm any tax-payers. As a bottom up venture, it did not go through the level of planning one would expect for large projects. The policy design requirements need to be stringent for large projects which are funded by the tax-payer money and these should be well documented particularly given that the organizations behind their execution claim expertise.
(In the next part I try to specify a layperson's [mine] expectations of biodiversity mapping projects)
- Lozupone, Patsy, Bruce M. Beehler, and S. Dillon Ripley. (2004). Ornithological Gazetteer of the Indian Subcontinent. Center for Applied Biodiversity Science, Conservation International, Washington, DC, USA.
- Ali, Salim (1980). "Indian Ornithology: The Current Trends". Bull. Brit. Orn. Club 100 (1): 80–83.
- Wright, Alex (2010) Managing Scientific Inquiry in a Laboratory the Size of the Web. NY Times. December 27, 2010
Postscript
31 May 2012 : An interesting source on this topic is by Jane R. Camerini (1993). Evolution, Biogeography, and Maps: An Early History of Wallace's Line. Isis 84(4):700-727. Some of the earliest biological maps are by Eberhardt A. W. von Zimmermann, Specimen zoologiae geographicae, quadrupedum domocilia et migrationes sistens (Leiden/Batavia: Theodorum Haak, 1777) as well as in Geographische Geschichte des Menschen und der Allgemein Verbreiteten Viefussigen Thiere (Leipzig: Weygandschen, 1778-1783). Other examples included here are de Candolle and Jean B. A. P. M. de Lamarck, Flore francaise . . . , 3rd ed. (Paris: Desray, 1805); Alexander von Humboldt and Aime Bonpland, Essai sur la geographie des plants (Paris: Levrault, Schoell, 1805); and Joachim F. Schouw, Pflanzengeographischer Atlas zur Erlauterung von Schouws Grundzugen einer allgemeinen Pflanzengeographie (Berlin: Reimer, 1823).
No comments:
Post a Comment